Back to Blog
Guides
4 min read

Inter-Rater Reliability: Cohen's Kappa Calculator

Inter-rater reliability is a methodological requirement for systematic reviews, and Cohen's kappa is the standard statistic. This guide explains when kappa applies, how to interpret the Landis and Koch scale, and what to do when prevalence or bias inflates or deflates your result.

Dr. Sarah Mitchell

April 18, 2026

Want to try this yourself? Use our free research tools, no sign-up required.

Key Takeaways

Cohen's kappa corrects raw agreement for chance, making it the appropriate reliability statistic for systematic review screening.

The Landis and Koch scale classifies kappa from slight (0.00 to 0.20) to almost perfect (0.81 to 1.00). Substantial agreement (0.61+) is the typical minimum.

Unweighted kappa is correct for binary decisions. Weighted kappa applies to ordinal scales.

A high prevalence index can depress kappa well below what raw agreement suggests. Report both statistics.

A high bias index signals a calibration problem between raters.

Run a pilot calibration before full screening, discuss disagreements, and report kappa with confidence interval in your methods.

Every systematic review that involves human raters making categorical decisions requires a measure of agreement that goes beyond simple percentage overlap. Cohen's kappa, introduced by Jacob Cohen in 1960, corrects for the agreement you would expect by chance alone, producing a statistic that reflects only the genuine concordance between raters. Without this correction, two reviewers who both exclude 95% of records will appear to agree 90% of the time purely by coincidence, masking real disagreements that affect the validity of your review.

This guide covers the full practical workflow: when kappa is appropriate, how to calculate it by hand, how to use our free interrater agreement calculator, how to interpret results using the Landis and Koch (1977) benchmarks, and how to handle the many situations where kappa can mislead you. Whether you are screening titles and abstracts, resolving full-text disagreements, or measuring consistency during data extraction, this resource gives you the statistical foundation and reporting language you need. To do the dual screening itself, our free two-reviewer screening tool with kappa agreement scores agreement and lists every conflict.

When Cohen's Kappa Applies

Kappa is appropriate when you have exactly two raters assigning the same set of items to the same nominal categories. The classic use case in a systematic review is dual screening: two independent reviewers each label a record as "include" or "exclude." Because those labels are categorical and the raters are fixed, Cohen's kappa is the correct statistic.

Kappa does not apply when you have continuous measurements (use the intraclass correlation coefficient instead), when categories are ordinal and the distance between disagreements matters (use weighted kappa), or when three or more raters classify items simultaneously (use Fleiss' kappa). Using the wrong statistic undermines the credibility of your reliability reporting.

The Relationship Between Raw Agreement and Kappa

Raw percent agreement simply divides the number of concordant decisions by the total number of items. It ignores the fact that raters will agree on some items by pure chance. Kappa subtracts this expected agreement from the observed agreement, then divides by the maximum possible improvement over chance:

Kappa = (Po - Pe) / (1 - Pe)

Where Po is observed agreement and Pe is expected agreement under independence. This formula means kappa can be negative (agreement worse than chance), zero (agreement equals chance), or positive up to 1.0 (perfect agreement).

Calculating Kappa by Hand: A 2x2 Contingency Table Walkthrough

Understanding the manual calculation builds intuition about what kappa actually measures. Suppose two reviewers screen 200 records for a systematic review on intervention effectiveness. Their decisions form a 2x2 contingency table:

Reviewer B: IncludeReviewer B: ExcludeRow Total
Reviewer A: Include30838
Reviewer A: Exclude12150162
Column Total42158200

Step 1: Calculate observed agreement (Po). The diagonal cells represent concordant decisions. Po = (30 + 150) / 200 = 0.90.

Step 2: Calculate expected agreement (Pe). For the "include/include" cell, the expected count under independence is (38 x 42) / 200 = 7.98. For the "exclude/exclude" cell, the expected count is (162 x 158) / 200 = 127.98. So Pe = (7.98 + 127.98) / 200 = 0.6798.

Step 3: Calculate kappa. Kappa = (0.90 - 0.6798) / (1 - 0.6798) = 0.2202 / 0.3202 = 0.688.

This result falls in the substantial agreement range on the Landis and Koch scale. You can verify this result instantly using our Cohen's kappa calculator, which also provides the standard error and 95% confidence interval.

Step 4: Calculate the standard error. The standard error for kappa allows you to construct a confidence interval. For the example above, the 95% confidence interval would be approximately 0.57 to 0.81, meaning you can be confident the true agreement level is at least moderate and possibly almost perfect.
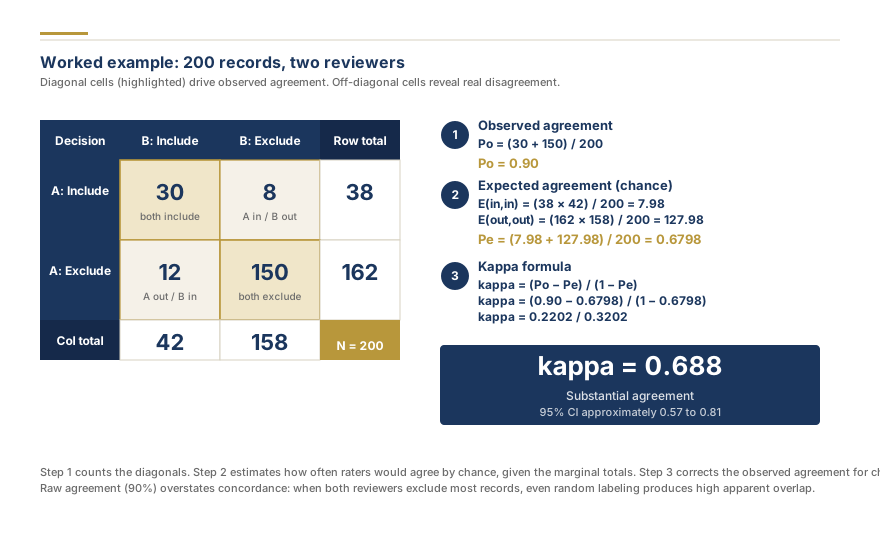
Cohen's kappa worked example: 200 records screened by two reviewers; 2x2 contingency table with 30 both-include, 8 A-include B-exclude, 12 A-exclude B-include, 150 both-exclude; calculation steps yield Po=0.90, Pe=0.6798, kappa=0.688 (substantial agreement)
Figure 2. Worked kappa calculation on a 200-record screening example.

Using the Kappa Calculator

Navigate to the Cohen's kappa calculator and enter your data as a contingency table or item-by-item ratings. The output includes: observed agreement (Po), expected agreement (Pe), Cohen's kappa, standard error and 95% confidence interval, Landis and Koch benchmark category, prevalence index, and bias index.

The calculator handles the arithmetic and lets you focus on interpretation. For studies with ordinal rating scales, you can toggle between unweighted, linear weighted, and quadratic weighted kappa directly in the tool interface.

Interpreting Kappa: The Landis and Koch Scale

The most widely cited benchmarks for kappa come from Landis and Koch (1977). While these thresholds were originally proposed as guidelines rather than rigid cutoffs, they have become the standard reference in health sciences and systematic review methodology.

Kappa ValueStrength of Agreement
Below 0.00Poor
0.00 to 0.20Slight
0.21 to 0.40Fair
0.41 to 0.60Moderate
0.61 to 0.80Substantial
0.81 to 1.00Almost Perfect

For systematic review screening, kappa at or above 0.61 (substantial agreement) is generally the minimum acceptable level.
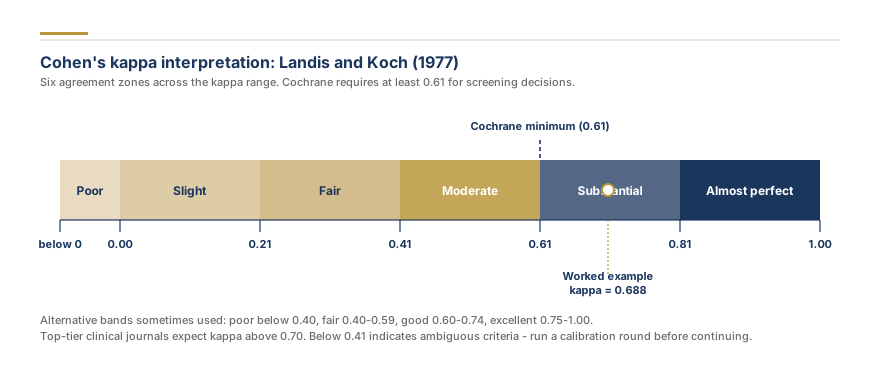
Cohen's kappa interpretation scale based on Landis and Koch 1977 benchmarks: poor (below 0), slight (0.00-0.20), fair (0.21-0.40), moderate (0.41-0.60), substantial (0.61-0.80), almost perfect (0.81-1.00); Cochrane minimum threshold marked at 0.61
Figure 1. Cohen's kappa interpretation thresholds (Landis and Koch 1977).

A kappa below 0.41 indicates that inclusion criteria are ambiguous or raters have not calibrated consistently. Re-examine criteria definitions and conduct a calibration exercise before proceeding with full screening.

Minimum Acceptable Kappa Thresholds by Journal and Field

Different disciplines and journals set different bars for what counts as adequate agreement. Cicchetti (1994) proposed an alternative framework that is commonly used in clinical and psychological research:

Kappa ValueCicchetti Classification
Below 0.40Poor
0.40 to 0.59Fair
0.60 to 0.74Good
0.75 to 1.00Excellent

Cochrane reviews expect at least substantial agreement (kappa 0.61 or above) for screening decisions. The Cochrane Handbook recommends that review teams report kappa for both title/abstract screening and full-text screening separately.

Clinical journals (BMJ, JAMA, Lancet) typically expect kappa above 0.70, and many editors consider values below 0.60 a reason to question the reliability of the review process. Psychology and education journals often cite Cicchetti's thresholds and consider 0.75 or above as the gold standard.

Nursing and public health journals tend to accept the Landis and Koch framework and consider substantial agreement (0.61+) sufficient, particularly when the prevalence index is high and raw agreement is documented alongside kappa.

When in doubt, check the specific reporting guidelines of your target journal and the relevant Cochrane or JBI methodology manual for your review type.

Weighted Kappa for Ordinal Data

When your rating categories have a natural order, not all disagreements are equally serious. A rater who assigns "high risk of bias" when the correct answer is "low risk" has made a larger error than one who assigns "unclear" instead of "low." Weighted kappa accounts for this by penalizing distant disagreements more heavily than adjacent ones.

Linear Versus Quadratic Weighting

Linear weights assign penalties proportional to the distance between categories. If you have three ordered categories (low, unclear, high), disagreement between low and unclear receives a penalty of 1, while disagreement between low and high receives a penalty of 2.

Quadratic weights assign penalties proportional to the squared distance. The low-to-high disagreement is penalized four times as heavily as the low-to-unclear disagreement. Quadratic weighting produces values that are mathematically equivalent to the intraclass correlation coefficient for a two-way random effects model, making it the preferred choice when you want direct comparability with ICC results.

When to Use Each Weighting Scheme

Use unweighted kappa for binary decisions: include versus exclude, yes versus no, present versus absent. This is the correct choice for title/abstract screening and full-text eligibility decisions.

Use linear weighted kappa when all adjacent-category disagreements carry equal practical importance, such as rating patient satisfaction on a 5-point scale.

Use quadratic weighted kappa for risk-of-bias assessments (low, some concerns, high) and quality appraisal tools where extreme disagreements are far more consequential than near-miss disagreements. This is the most common weighting scheme in systematic review methodology.

Our Cohen's kappa calculator supports all three options, so you can compare results across weighting schemes for the same dataset.

Need statistical analysis support?

Our PhD statisticians handle data analysis, produce reproducible R code, and write results sections that satisfy peer reviewers.

Fleiss' Kappa for Three or More Raters

Cohen's kappa is strictly a two-rater statistic. When your review team includes three or more raters, or when different subsets of raters evaluate different items, you need Fleiss' kappa, introduced by Joseph Fleiss in 1971. Unlike Cohen's kappa, Fleiss' kappa does not require the same two raters to evaluate every item, making it suitable for larger teams with distributed workloads.

The interpretation scale remains the same (Landis and Koch), but Fleiss' kappa values tend to be slightly lower than Cohen's kappa for the same data because disagreement among multiple raters is more common. A Fleiss' kappa of 0.55 to 0.65 is typical for screening decisions involving three reviewers, and this is generally considered acceptable.

When to use Fleiss' kappa in a systematic review:

  • You have three or more reviewers screening the same set of records
  • Different pairs of reviewers screen different batches, but you want one overall reliability metric
  • You are conducting a methodological study comparing reviewer agreement across multiple raters

If each rater provides a continuous measurement rather than a categorical judgment, use the ICC calculator instead.

ICC Versus Kappa: When to Use Which

Both the intraclass correlation coefficient (ICC) and Cohen's kappa measure agreement, but they apply to fundamentally different data types. Choosing the wrong one produces misleading results.

FeatureCohen's KappaICC
Data typeCategorical (nominal or ordinal)Continuous or interval
Number of ratersExactly 2 (use Fleiss' for 3+)2 or more
Chance correctionYes (based on marginal proportions)Yes (based on variance components)
Typical use in reviewsScreening decisions, quality ratingsData extraction of numerical values, effect size coding

Use kappa when reviewers make categorical decisions: include/exclude, high/low/unclear risk, or yes/no for checklist items. Use ICC when reviewers extract continuous data: sample sizes, means, standard deviations, or effect size estimates. For a detailed walkthrough on ICC, see our ICC calculator guide.

Practical rule: If the disagreement between raters can be expressed as a distance (one rater extracted a mean of 4.2 and the other extracted 4.5), use ICC. If the disagreement is a category mismatch (one rater said "include" and the other said "exclude"), use kappa.

Kappa for Different Review Stages

Agreement levels vary substantially across the stages of a systematic review, and reporting them separately provides a much clearer picture of your review's reliability than a single overall kappa value.

Title and Abstract Screening

This stage typically produces the lowest kappa values because decisions are based on limited information. Reviewers often disagree about borderline records where the abstract does not clearly address the population, intervention, or outcome. Kappa values of 0.60 to 0.75 are common and generally acceptable for this stage.

To improve agreement during title/abstract screening, write explicit decision rules for ambiguous cases (for example, "when the abstract does not mention the comparator, include the record for full-text review"). Learn more about setting up a reliable screening process in our guide on working with a second reviewer for systematic review screening.

Full-Text Screening

Full-text screening usually produces higher kappa values (0.75 to 0.90) because reviewers have access to complete study details. Disagreements at this stage are often about nuanced eligibility criteria rather than information gaps. If your full-text kappa is below 0.70, your eligibility criteria likely need revision.

Data Extraction

For categorical data extraction items (study design classification, risk-of-bias domains), report kappa. For continuous items (sample sizes, effect estimates), report ICC. PRISMA 2020 expects reliability to be documented for data extraction, not just screening. Extraction agreement is often highest (kappa 0.80+) because the task is more structured. Our guide on data extraction for systematic reviews covers the full process.

The Prevalence and Bias Problem

Prevalence effect: When inclusion rates are very low (common in screening), kappa can be substantially lower than the observed agreement suggests. Two raters with 98% raw agreement can have kappa of only 0.50. When the prevalence index is high, interpret kappa with caution and report raw agreement alongside it.

The prevalence index is calculated as the absolute difference between the diagonal cell proportions. When most records fall into one category (as in systematic review screening, where 90-99% of records are excluded), the paradox intensifies. Byrt, Bishop, and Carlin proposed the prevalence-adjusted bias-adjusted kappa (PABAK) as an alternative, but many methodologists prefer simply reporting both kappa and raw agreement.

Bias effect: When raters use categories at systematically different rates, kappa is deflated. If Reviewer A includes 15% of records while Reviewer B includes only 5%, the bias index will be high, signaling that the raters are applying different thresholds. This signals a calibration problem that must be resolved through discussion before continuing.

Common Mistakes That Artificially Inflate or Deflate Kappa

Understanding these pitfalls helps you avoid publishing misleading reliability statistics and protects your review from peer reviewer criticism.

Mistakes That Inflate Kappa

  • Screening only easy records during calibration. If your pilot set excludes borderline studies, kappa will be artificially high and will not predict agreement on the full dataset.
  • Resolving disagreements before calculating kappa. Kappa must be computed on independent ratings before any discussion or consensus process. Calculating it after resolution defeats the purpose.
  • Excluding "uncertain" records from the calculation. Removing difficult items inflates kappa. Include all records that both raters evaluated.
  • Using a very small sample. With fewer than 30 items, kappa is unstable and can be artificially high or low due to sampling variability. Pilot calibrations should include at least 50 records.

Mistakes That Deflate Kappa

  • High prevalence with no correction. As discussed above, when 95%+ of records fall into one category, kappa will be far lower than the actual level of rater agreement. Always report raw agreement alongside kappa in high-prevalence scenarios.
  • Poorly defined eligibility criteria. Ambiguous PICO elements cause genuine disagreements that deflate kappa. The fix is better criteria, not a different statistic.
  • Mixing experienced and novice raters without calibration. A new team member who has not been trained on the protocol will systematically disagree with the experienced reviewer, dragging kappa down.
  • Including records outside the scope. If your screening set includes records in languages neither reviewer reads, those forced guesses will deflate kappa.

What to Do When Kappa Is Low: Recalibration Strategies

A low kappa (below 0.60) does not mean your review is failed. It means your review team needs calibration before proceeding. Here is a structured recalibration protocol that consistently raises kappa in subsequent rounds.

Step 1: Categorize disagreements. Export all discordant records and tag each one with the reason for disagreement: unclear population, ambiguous intervention definition, outcome not specified, study design uncertainty, or language/terminology confusion.

Step 2: Identify the dominant pattern. Usually 60-80% of disagreements cluster around one or two eligibility criteria. Focus your recalibration discussion on those specific criteria.

Step 3: Write explicit decision rules. For each problematic criterion, create an "if/then" rule that eliminates ambiguity. For example: "If the study includes both adults and children and does not report results separately, include it and flag for subgroup analysis at full-text stage."

Step 4: Re-screen a new random sample. Do not re-screen the same records you already discussed, because both reviewers now know the "correct" answers. Pull 50 fresh records and screen independently.

Step 5: Recalculate kappa. If kappa is now 0.60 or above, proceed with full screening. If not, repeat steps 1 through 4. Most teams achieve adequate agreement within two calibration rounds.

Step 6: Document everything. Record each calibration round, the decision rules created, and the kappa achieved. This documentation is valuable for your methods section and for addressing peer reviewer questions.

If you need expert help designing your screening protocol or resolving persistent calibration challenges, our team at Research Gold has guided hundreds of review teams through this process. Request a free consultation to discuss your project.

Worked Example With Real Screening Data

Consider a systematic review on the effectiveness of telehealth interventions for managing chronic pain. Two reviewers independently screen 150 titles and abstracts using the following eligibility criteria: adults with chronic pain (>3 months), telehealth-delivered intervention, randomized controlled trial, pain outcome measured.

Round 1 results (before calibration):

Reviewer B: IncludeReviewer B: ExcludeTotal
Reviewer A: Include12921
Reviewer A: Exclude6123129
Total18132150

Po = (12 + 123) / 150 = 0.90. Pe = ((21 x 18) + (129 x 132)) / 150^2 = (378 + 17028) / 22500 = 0.7736. Kappa = (0.90 - 0.7736) / (1 - 0.7736) = 0.558 (moderate agreement).

Despite 90% raw agreement, kappa is only moderate because of the high prevalence of excluded records. The disagreements (15 records) cluster around two issues: (1) studies using "telephone follow-up" that may or may not count as telehealth, and (2) studies with mixed acute/chronic pain populations.

Calibration action: The team writes two decision rules. First, telephone-only interventions count as telehealth if they involve structured therapeutic sessions (not simple appointment reminders). Second, mixed-population studies are included if at least 80% of participants have chronic pain or if chronic pain results are reported separately.

Round 2 results (after calibration, new 50-record sample):

Reviewer B: IncludeReviewer B: ExcludeTotal
Reviewer A: Include516
Reviewer A: Exclude14344
Total64450

Po = (5 + 43) / 50 = 0.96. Pe = ((6 x 6) + (44 x 44)) / 50^2 = (36 + 1936) / 2500 = 0.7888. Kappa = (0.96 - 0.7888) / (1 - 0.7888) = 0.811 (almost perfect agreement).

Two calibration rules transformed moderate agreement into almost perfect agreement. This example demonstrates why pilot calibration is the single most important step in ensuring reliable screening.

Reporting Inter-Rater Reliability in Your Methods Section

PRISMA 2020 (Item 8) requires authors to describe the process used for selecting studies, including any measures of agreement between reviewers. The Cochrane Handbook further recommends reporting kappa with confidence intervals at each review stage.

What to Include in Your Methods

Your reliability reporting should cover these elements:

  1. The statistic used and why. State that you used Cohen's kappa for binary screening decisions, weighted kappa for ordinal assessments, or ICC for continuous data extraction. Cite Cohen (1960) for kappa and Shrout and Fleiss (1979) for ICC.
  2. The sample size for calibration. Report how many records were used in each pilot round.
  3. The kappa value with 95% confidence interval. A point estimate alone is insufficient because kappa varies with sample size.
  4. The interpretation framework. Cite Landis and Koch (1977) or Cicchetti (1994) and state which threshold you considered acceptable.
  5. Prevalence and bias indices when the distribution of categories is highly skewed.
  6. The resolution process. Describe how disagreements were resolved (discussion, third reviewer, senior author adjudication).

Example Methods Paragraph

"Two reviewers (XX and YY) independently screened all titles and abstracts against the predefined eligibility criteria. A pilot calibration exercise was conducted on 100 randomly selected records, achieving a Cohen's kappa of 0.72 (95% CI: 0.61 to 0.83), indicating substantial agreement (Landis and Koch, 1977). Decision rules were refined based on disagreement patterns, and full screening proceeded with a final kappa of 0.81 (95% CI: 0.74 to 0.88). Disagreements were resolved through discussion, with a third reviewer (ZZ) consulted for unresolved cases. For data extraction, intraclass correlation coefficients ranged from 0.89 to 0.95 for continuous outcomes."

For a complete guide to structuring your review from protocol to publication, see our step-by-step walkthrough on how to write a systematic review.

Practical Screening Workflow

A well-structured reliability workflow prevents the most common problems before they arise. Follow this sequence for every systematic review that involves two or more human raters.

  1. Develop clear eligibility criteria with explicit decision rules for borderline scenarios. Write these as "if/then" statements, not vague descriptions.
  2. Pilot calibration: Both reviewers screen 50 to 100 random records independently. Compute kappa, discuss every disagreement, and revise criteria as needed.
  3. Assess calibration adequacy. If kappa is below 0.60, conduct a second calibration round on fresh records. Do not proceed until substantial agreement is achieved.
  4. Full independent screening. Each reviewer screens the complete set of records without discussing individual decisions.
  5. Kappa computation with prevalence and bias checks. Use our Cohen's kappa calculator for instant results with confidence intervals.
  6. Disagreement resolution through discussion or a third reviewer. Document the number and nature of disagreements resolved.
  7. Reporting in the methods section with kappa, confidence interval, prevalence index, and resolution process.

For chi-square-based tests of association between categorical variables, see our online chi-square calculator.

Key Takeaways

  • Cohen's kappa corrects raw agreement for chance, making it the appropriate reliability statistic for systematic review screening with two raters.
  • The Landis and Koch (1977) scale classifies kappa from slight (0.00 to 0.20) to almost perfect (0.81 to 1.00). Substantial agreement (0.61+) is the typical minimum for systematic reviews.
  • Unweighted kappa is correct for binary include/exclude decisions. Weighted kappa (linear or quadratic) applies to ordinal scales like risk-of-bias ratings.
  • Use Fleiss' kappa when three or more raters classify items. Use ICC (via our ICC calculator) when raters provide continuous measurements.
  • A high prevalence index can depress kappa well below what raw agreement suggests. Report both statistics.
  • A high bias index signals a calibration problem between raters that must be addressed before full screening.
  • Calculate kappa separately for title/abstract screening, full-text screening, and data extraction. Each stage has different expected agreement levels.
  • When kappa is low, follow a structured recalibration protocol: categorize disagreements, write decision rules, re-screen fresh records, and repeat until agreement is adequate.
  • Common mistakes like screening only easy records, using small samples, or resolving disagreements before calculating kappa produce misleading reliability statistics.
  • Report kappa with 95% confidence intervals and cite both the statistic source (Cohen, 1960) and interpretation framework (Landis and Koch, 1977) in your methods section, as required by PRISMA 2020.
  • Run a pilot calibration before full screening, discuss disagreements systematically, and document every calibration round for transparency.

Inter-rater reliability is one of the foundations that separates a credible systematic review from a literature summary. Getting it right requires careful planning, proper statistical measurement, and transparent reporting. If you need help designing your screening protocol, calibrating your review team, or interpreting your reliability results, our systematic review experts can guide you through every stage. Get a free quote today and let us help you build a review that stands up to peer review scrutiny.

Frequently Asked Questions

5
Most guidelines treat kappa at or above 0.61 as the minimum acceptable level. Cochrane reviews require all disagreements be resolved regardless of kappa value.
Percentage agreement ignores chance agreement. Cohen's kappa subtracts expected chance agreement, measuring only agreement exceeding chance.
Use weighted kappa when the rating scale is ordinal (like low, unclear, high risk of bias). For binary decisions, use unweighted kappa.
Standard Cohen's kappa applies to exactly two raters. For three or more, use Fleiss' kappa. For continuous ratings, use our [ICC Calculator](/resources/icc-calculator).
The vast majority of items fall into one category. Kappa is inherently unstable in this situation. Report raw observed agreement alongside kappa and consider prevalence-adjusted bias-adjusted kappa (PABAK). Need help with your systematic review or meta-analysis? [Get a free quote](/get-a-quote) from our team of PhD researchers.
Share

Found this useful? Share it with your colleagues.

Need statistical analysis support?

Our PhD statisticians handle data analysis, produce reproducible R code, and write results sections that satisfy peer reviewers.

Explore our Biostatistics Service, handled end-to-end by a PhD methodologist.

Biostatistics Support

Need a Statistician? Our PhD Team Handles the Numbers.

From data cleaning to advanced statistical analysis, reproducible R code, and a results section ready for peer review. We handle the stats so you focus on the science.

Our promise: Free re-run and re-write if reviewers question the analysis or reporting.

4.9 / 5Quote within a few hoursReproducible R or Stata codePhD methodologistConfidential by default
Chat on WhatsApp now
DS

Written by

Dr. Sarah Mitchell

PhD, Biostatistics & Research Methodology
Systematic Review MethodologyMeta-AnalysisBiostatistics

Dr. Sarah Mitchell holds a PhD in Biostatistics from Johns Hopkins Bloomberg School of Public Health and has over 15 years of experience in systematic review methodology and meta-analysis. She has authored or co-authored 40+ peer-reviewed publications in journals including the Journal of Clinical Epidemiology, BMC Medical Research Methodology, and Research Synthesis Methods. A former Cochrane Review Group statistician and current editorial board member of Systematic Reviews, Dr. Mitchell has supervised 200+ evidence synthesis projects across clinical medicine, public health, and social sciences.

Need professional help with your systematic review or meta-analysis? Get a free quote from our team of PhD researchers.

Need a Statistician? Our PhD Team Handles the Numbers.

From data cleaning to advanced statistical analysis, reproducible R code, and a results section ready for peer review. We handle the stats so you focus on the science.

Quote within a few hours. Pay only after you approve your quote. Unlimited revisions within your agreed scope. Confidential by default.