Every meta-analysis rests on an implicit assumption: that no single study is so dominant that removing it would overturn the conclusions. Leave-one-out sensitivity analysis tests that assumption directly. By systematically omitting one study at a time and re-estimating the pooled effect, you produce a clear picture of how much each study drives your result. This procedure is one of the most requested sensitivity checks in peer review, and reviewers for journals indexed in PubMed, Cochrane, and PROSPERO routinely expect to see it reported.
When the pooled effect stays stable across all iterations, your conclusion is robust. When one omission shifts the estimate dramatically, you have an influential study that demands explanation. This guide walks through every aspect of leave-one-out analysis, from visual interpretation to advanced influence diagnostics, with a worked example you can replicate using our free robustness check tool or the metafor package in R.
What Makes a Study Influential
Three mechanisms create influential studies, and understanding them helps you explain your findings to reviewers rather than simply reporting numbers.
Precision leverage occurs when a study has an exceptionally small variance, giving it high statistical weight. A large randomized controlled trial in a pool of smaller observational studies will often dominate the pooled estimate simply because its confidence interval is narrow. Under a random-effects model, precision leverage is partially dampened by the between-study variance component (tau-squared), but it still matters.
Effect size discordance occurs when a study's point estimate is far from the other studies in the pool. A study reporting a standardized mean difference of 1.8 in a pool where the other nine studies range from 0.3 to 0.7 will pull the pooled estimate upward. When that study is removed, the pooled effect drops noticeably.
Heterogeneity contribution is more subtle: a study can inflate tau-squared, changing how all weights are distributed under a random-effects model. Removing such a study not only shifts the point estimate but also narrows the confidence interval for every remaining study because the between-study variance decreases. This is the mechanism most often missed by researchers who focus only on point estimates.
Try our free leave-one-out calculator to identify all three types of influential studies instantly.
How Leave-One-Out Analysis Works
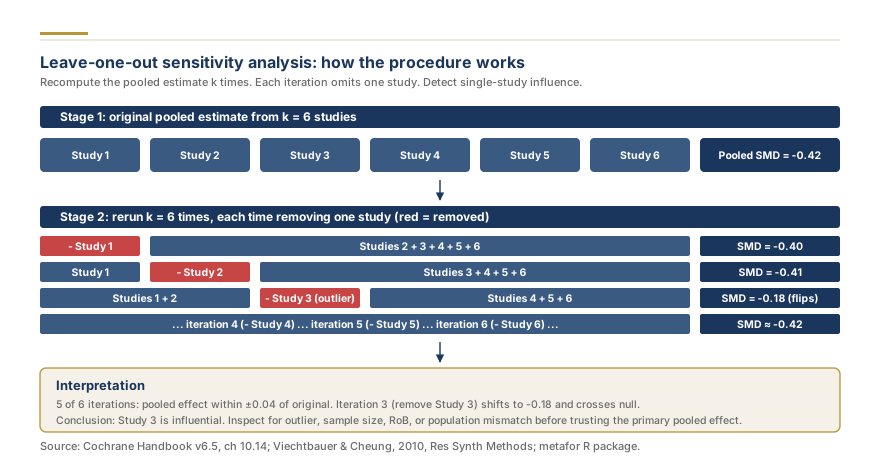
For a meta-analysis with k studies: remove study 1, re-fit the model on k-1 studies, record the pooled effect, confidence interval, p-value, and heterogeneity statistics. Restore study 1, remove study 2. Continue until every study has been omitted once.
The output is a table or forest-style plot showing k rows of pooled estimates, each representing the analysis with one study excluded. In R, the metafor package (Viechtbauer, 2010) provides the leave1out() function that automates this procedure for any fitted rma() model object.
Running the Analysis with Our Free Tool
Navigate to the robustness check tool and enter your study labels, effect sizes, and standard errors. The tool runs the full leave-one-out procedure automatically and displays a leave-one-out forest plot with color coding for studies where exclusion changes significance.
The one-click export provides the equivalent R code using the leave1out() function from the metafor package.
How to Read a Leave-One-Out Forest Plot
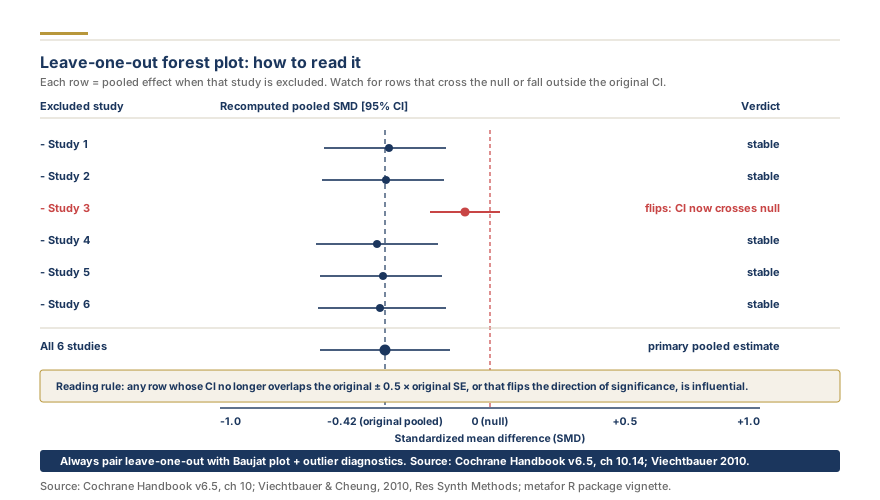
A leave-one-out forest plot looks similar to a standard forest plot but communicates different information. Each row represents the pooled result after excluding one study, not the individual study's effect. Here is how to read it systematically.
The vertical reference line marks the overall pooled estimate from the full model (all k studies included). Each row's point estimate shows where the pooled effect lands when that specific study is removed. If all point estimates cluster tightly around the reference line, the meta-analysis is stable.
Confidence intervals on each row represent the precision of the reduced-k model. Watch for rows where the confidence interval crosses the null (zero for mean differences, one for odds ratios) when the full model's interval did not. That crossing signals a significance change, the most important finding in leave-one-out analysis.
Color coding in our online sensitivity analysis highlights rows where removing a study changes statistical significance. Red rows indicate that excluding that study makes the result non-significant. Green rows (less common) indicate that excluding a study strengthens significance by removing heterogeneity.
Use the interactive forest plot builder alongside the leave-one-out plot to compare each study's individual effect against the pooled estimate and visually identify which studies are discordant.
Interpreting Results
When Results Are Robust
If all k pooled estimates cluster tightly around the original estimate and confidence intervals consistently include or exclude zero across all iterations, your conclusion is robust. Report this explicitly. Reviewers value a clear statement such as: "Leave-one-out sensitivity analysis confirmed that no single study altered the direction, magnitude, or statistical significance of the pooled effect."
When One Study Changes Significance
Investigate the influential study along four dimensions: sample size and population, methodological quality, effect size and direction, and publication context.
After investigation, present both the full-model and leave-one-out estimates as co-primary results, or conduct a subgroup analysis separating the outlying study. Document whether the influential study differed in risk of bias, population characteristics, intervention dosage, or follow-up duration.
Use the forest plot software to visualize the study's position relative to the rest of the pool.
When Multiple Studies Are Influential
If removing several different studies each changes significance, the meta-analysis has a fragility problem. Report it honestly and recommend further primary research. Calculate the fragility index to quantify how many studies would need to change their event counts to reverse the result, and present this alongside the leave-one-out findings.
Significance Change Detection
Two criteria define a meaningful change: a clinically meaningful shift in the point estimate (a change exceeding the minimally important difference for the outcome), and a change in statistical significance (confidence interval changes from excluding to including the null, or vice versa).
The interactive funnel plot builder helps identify outliers before running leave-one-out analysis, giving you a visual preview of which studies sit far from the regression line.
When Leave-One-Out Analysis Is Insufficient
Leave-one-out analysis answers one question: what happens to the pooled effect when each study is removed individually? It does not capture jointly influential study pairs, and it does not quantify the specific mechanism of influence. For a deeper diagnosis, you need formal influence diagnostics.
Cook's Distance
Cook's distance measures how much all fitted values change when a study is removed. It combines leverage (how unusual a study's precision is) with residual magnitude (how far the study's effect is from the model prediction). A study with a high Cook's distance is influential through both mechanisms simultaneously. In the metafor package, this is available through the cooks.distance() method on a fitted rma() object.
DFBETAS
DFBETAS quantifies how much each model coefficient changes (in standard error units) when a study is deleted. For a simple random-effects meta-analysis with one pooled estimate, DFBETAS tells you whether a study shifts the intercept by more than a threshold (commonly 2 divided by the square root of k). Studies exceeding this threshold are considered influential.
Hat Values (Leverage)
Hat values measure a study's leverage, which is its potential to influence the pooled estimate based on precision alone. A study with a hat value much larger than the average (which equals the number of coefficients divided by k) has high leverage. High leverage combined with a large residual produces influence. Hat values are available through the hatvalues() method in metafor.
DFFITS
DFFITS measures the change in the fitted value for a study when it is deleted, standardized by the study's standard error. It is the individual-study analog of Cook's distance and follows a threshold of 2 times the square root of the number of coefficients divided by k.
Baujat Plot as a Complement to Leave-One-Out
The Baujat plot (Baujat et al., 2002) provides a two-dimensional view of study influence that leave-one-out analysis alone cannot offer. The x-axis shows each study's contribution to the overall heterogeneity statistic (Q), and the y-axis shows each study's influence on the pooled effect.
Studies in the upper-right quadrant are the most problematic: they contribute substantially to heterogeneity and pull the pooled estimate. Studies in the lower-right quadrant contribute to heterogeneity but do not shift the pooled result much, suggesting they add noise without changing the conclusion. Studies in the upper-left quadrant shift the result despite not contributing much to heterogeneity, indicating precision leverage.
Read our detailed guide on Galbraith plots and Baujat plots for heterogeneity diagnostics for a full walkthrough of visual diagnostic strategies, including when to use each plot type.
To generate a Baujat plot in R with metafor, call baujat(model) on your fitted rma() object. Our meta-analysis sensitivity calculator also displays Baujat-style information when you run the full diagnostics panel.
Influence Diagnostics in metafor: The inf.rma() Function
The metafor package by Viechtbauer (2010) provides a comprehensive influence diagnostics framework through the influence() function (also accessible as inf.rma() in earlier versions). Viechtbauer and Cheung (2010) formalized these diagnostics for meta-analysis, adapting established regression diagnostics to the meta-analytic context.
Running a Full Influence Analysis
library(metafor)

# Fit random-effects model
res <- rma(yi, vi, data = dat)

# Run full influence diagnostics
inf <- influence(res)

# View all diagnostics in a single plot
plot(inf)

# Access individual measures
inf$inf      # rstudent, dffits, cook.d, cov.r, tau2.del, QE.del, hat, weight
The influence() function returns a structured object containing externally standardized residuals (rstudent), DFFITS, Cook's distance, covariance ratio (cov.r), tau-squared when deleted (tau2.del), Q-statistic when deleted (QE.del), hat values, and percentage weights. The plot() method displays all of these in a multi-panel diagnostic plot, making it easy to identify studies that are flagged across multiple measures.
Interpreting the Diagnostic Plot
The default plot from plot(influence(res)) shows eight panels. Look for studies that appear as outliers in multiple panels simultaneously. A study flagged only on hat values (high leverage but small residual) may not be problematic. A study flagged on rstudent, Cook's distance, and DFFITS simultaneously is almost certainly influential and warrants investigation.
The covariance ratio (cov.r) deserves special attention. Values below 1 indicate that removing the study decreases the variance of the pooled estimate, meaning the study was inflating uncertainty. Values well above 1 indicate that removing the study increases variance, meaning the study was stabilizing the estimate.
How to Handle an Influential Study
Identifying an influential study is only the first step. The Cochrane Handbook recommends a structured response rather than automatic exclusion.
Option 1: Retain and Report Transparently
If the influential study is methodologically sound and clinically relevant, keep it in the primary analysis. Report the leave-one-out result as a planned sensitivity analysis and discuss why the study differs. This is the most common and most defensible approach.
Option 2: Conduct Subgroup or Meta-Regression Analysis
If the influential study differs on a pre-specified characteristic (different population, different intervention dose, different comparator, higher risk of bias), conduct a subgroup analysis or meta-regression to test whether that characteristic explains the heterogeneity. This turns an influential outlier into a moderator finding, which is scientifically more valuable than simple exclusion.
Option 3: Present a Sensitivity Table
Create a sensitivity analysis table showing the pooled estimate under multiple scenarios: all studies included, influential study excluded, restricted to low risk-of-bias studies, and restricted to the pre-specified primary outcome only. This approach gives readers and reviewers the full picture without forcing a single analytic decision.
Option 4: Remove with Justification
Remove the influential study only if there is a substantive methodological reason (critical risk of bias, protocol deviation, wrong population) that justifies exclusion independently of the sensitivity analysis result. Never remove a study solely because it changes your result. Reviewers will flag this as outcome-driven exclusion.
If you need help deciding how to handle influential studies in your meta-analysis, our team provides expert guidance on meta-analysis methodology including full sensitivity and influence diagnostic reporting.