Intraclass Correlation Coefficient: Models and Reporting
Intraclass correlation coefficient measures reliability of continuous ratings. Guide to Shrout-Fleiss models, Koo and Li 2016 selection, R/SPSS software, reporting.
Dr. Sarah Mitchell
May 13, 2026
Key Takeaways
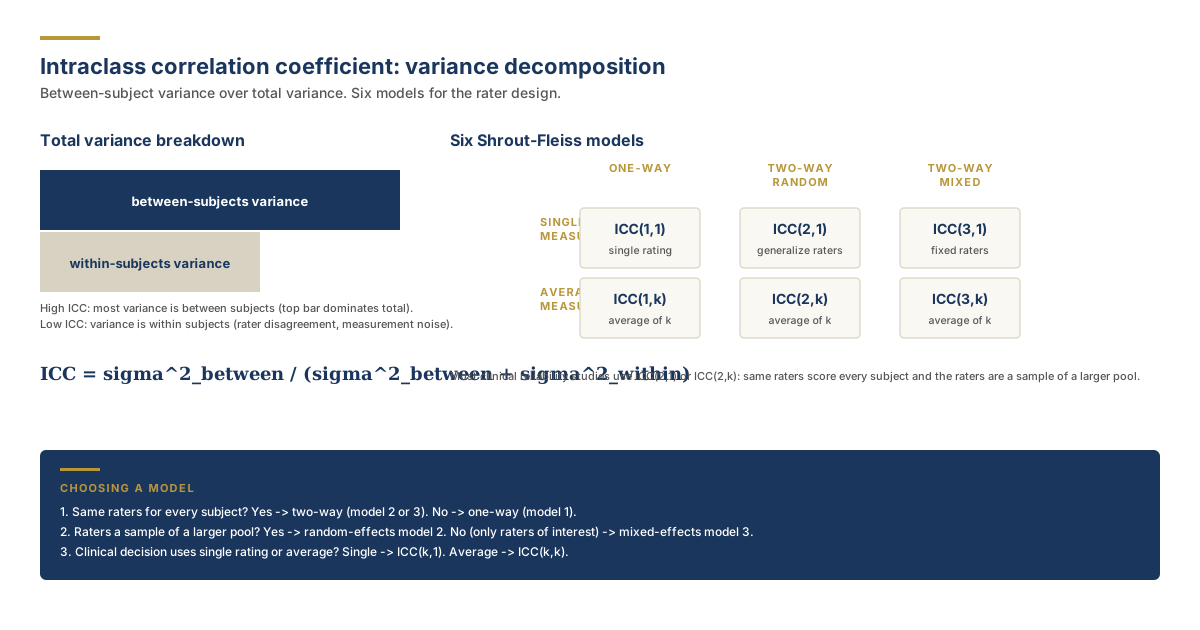
The intraclass correlation coefficient measures the proportion of total variance attributable to differences between subjects. Values range from 0 (no reliability) to 1 (perfect reliability). Unlike Pearson correlation, it can be configured to penalize systematic rater bias.
Shrout and Fleiss 1979 defined six ICC models indexed by model number (1, 2, 3) and unit (1 for single-measure, k for average-measure): ICC(1,1), ICC(1,k), ICC(2,1), ICC(2,k), ICC(3,1), ICC(3,k). The most common in clinical reliability research is ICC(2,1).
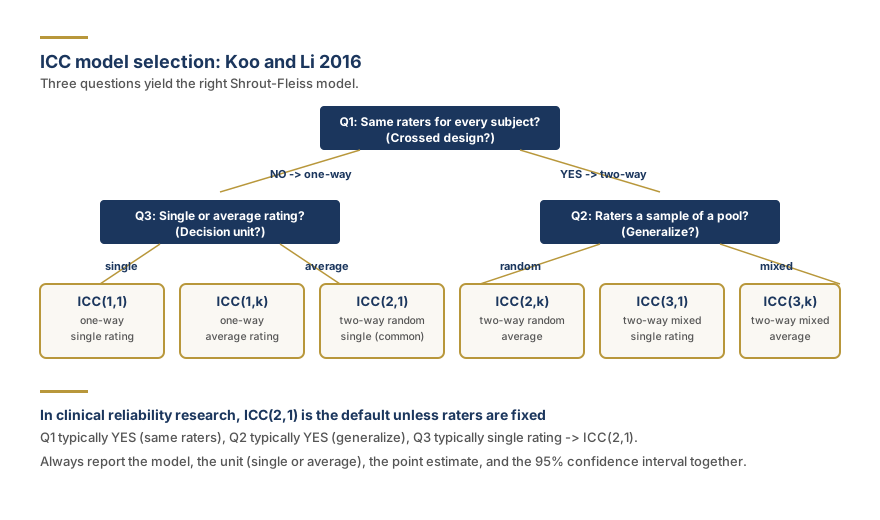
Koo and Li 2016 selection framework asks three questions: (1) same raters for every subject? Two-way model. (2) Raters a sample of a pool? Random-effects model 2 versus mixed-effects model 3. (3) Single rating or average decision? Single- versus average-measure.
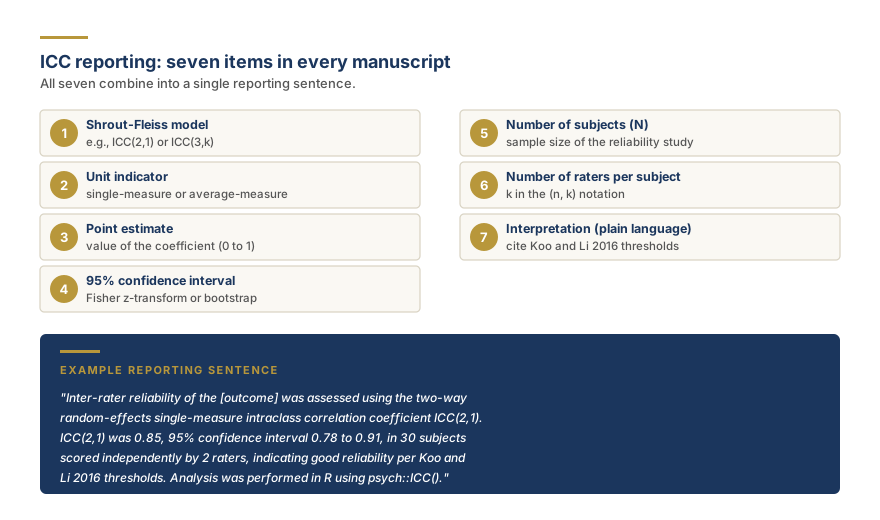
Always report the model, the unit indicator, the point estimate, the 95% confidence interval, the number of subjects, the number of raters, and the interpretation in plain language. Koo and Li 2016 thresholds: below 0.50 poor, 0.50-0.75 moderate, 0.75-0.90 good, above 0.90 excellent.
Software: R psych::ICC() computes all six models simultaneously with Fisher confidence intervals. R irr::icc() computes a single model. SPSS Reliability Analysis, Stata icc command, and Python pingouin all support the Shrout-Fleiss models with the same selection logic.
The intraclass correlation coefficient measures the proportion of total variance in a measurement that is attributable to differences between subjects, used to quantify agreement or reliability among raters or repeated measurements on a continuous outcome. ICC is the right statistic when two or more raters score the same subjects on a continuous scale, or when one rater scores the same subject more than once, and the question is how much of the variance reflects real differences between subjects versus measurement noise. Unlike Pearson correlation, which captures linear association regardless of agreement, the intraclass correlation coefficient distinguishes systematic rater bias from random error, the same split that underlies reliability versus validity, and produces a single coefficient in which 0 means no reliability and 1 means perfect reliability.
Intraclass correlation coefficient as variance decomposition with the six Shrout-Fleiss models
The coefficient was introduced by Ronald Fisher in 1925 and formalized for inter-rater reliability in Patrick Shrout and Joseph Fleiss's 1979 Psychological Bulletin paper, which defined the six ICC models that remain canonical. Terry Koo and Mae Li's 2016 Journal of Chiropractic Medicine paper, "A Guideline of Selecting and Reporting Intraclass Correlation Coefficients for Reliability Research", provides the modern selection framework most clinical researchers use.
The Six Shrout and Fleiss Models and How to Pick the Right One
Shrout and Fleiss 1979 defined six intraclass correlation coefficient models indexed by two numbers: the model number (1, 2, or 3) and the unit indicator (1 for single-measure, k for average-measure). The six combinations are ICC(1,1), ICC(1,k), ICC(2,1), ICC(2,k), ICC(3,1), ICC(3,k).
ICC(1,1) is the one-way random-effects single-measure coefficient. Each subject is assessed by a different set of randomly selected raters; ratings are nested within subjects. This is the right model when there is no fixed crossed design (for example, when each patient is seen by a different doctor pulled at random from a pool).
ICC(1,k) is the one-way random-effects average-measure coefficient. Same design as ICC(1,1) but the unit being reported is the average of k ratings rather than a single rating. Use this when the clinical decision rule is based on averaging multiple raters' scores.
ICC(2,1) is the two-way random-effects single-measure coefficient. Each subject is assessed by the same set of raters who were randomly selected from a larger pool. Raters are crossed with subjects; both are random factors. Use this when the raters in the study are a sample of a broader population of raters to whom the result will generalize.
ICC(2,k) is the two-way random-effects average-measure coefficient. Same design as ICC(2,1) but reports the average-of-k coefficient.
ICC(3,1) is the two-way mixed-effects single-measure coefficient. Each subject is assessed by the same set of raters, but the raters are not a random sample; they are the only raters of interest and inferences will not generalize beyond them. Raters are a fixed factor; subjects are random.
ICC(3,k) is the two-way mixed-effects average-measure coefficient. Same as ICC(3,1) but reports the average-of-k coefficient.
The choice between models 1, 2, and 3 hinges on the rater-selection question. The choice between single-measure and average-measure depends on the unit of reporting. These two choices, combined, determine the coefficient.
The Mathematical Definition: Variance Components
ICC is defined as a ratio of variance components. For the simplest one-way random-effects model:
Where sigma^2_between is the variance attributable to systematic differences between subjects and sigma^2_within is the variance attributable to measurement error within subjects (across the multiple raters or repeated measurements). When all variance is between subjects (perfect reliability), ICC = 1. When all variance is within subjects (no reliability), ICC = 0.
For the two-way models (2 and 3), the variance decomposition becomes more complex because rater variance is separated from residual error. The two-way random-effects ICC(2,1) is:
This last form is structurally identical to the older Pearson product-moment correlation when subjects are crossed with two raters and the raters' systematic difference is ignored.
The variance components themselves are estimated from a one-way or two-way analysis of variance applied to the rater-by-subject matrix. The analysis of variance variance components walkthrough covers how the mean squares decompose; ICC simply uses those mean squares in specific ratios that depend on the model.
Koo and Li's 2016 Selection Framework
Koo and Li 2016 distilled the model-selection problem into three questions.
Question 1: Is the same set of raters scoring every subject? If yes, you are in a two-way (model 2 or 3) framework. If no, you are in a one-way (model 1) framework. Most reliability studies use the same raters for every subject, putting them in model 2 or model 3.
Question 2: Are the raters in the study a representative sample of a larger rater pool, or are they the only raters of interest? If they are a sample (and the researcher wants to generalize to other raters), use model 2 (two-way random-effects). If they are the only raters of interest (the result will not generalize beyond them), use model 3 (two-way mixed-effects). In practice, most published reliability studies use model 2 because the goal is to generalize.
Question 3: What is the unit of reporting? If the clinical decision rule scores each subject with a single rater, report single-measure. If the rule averages multiple raters' scores, report average-measure (the k subscript).
Koo and Li also recommend reporting the model, the single-measure or average-measure designation, and the 95% confidence interval in the same statement, for example: "ICC(2,1) = 0.85, 95% CI 0.78 to 0.91, two-way random-effects, single-measure."
Koo and Li 2016 decision tree for ICC model selection
ICC Versus Pearson Correlation Versus Cohen's Kappa
The three coefficients answer different questions.
Pearson product-moment correlation measures the strength of linear association between two continuous variables. It is symmetric in the two variables. Importantly, Pearson r ignores systematic bias: if Rater A scores everyone exactly 1 point higher than Rater B, Pearson r is 1.0 even though the raters do not agree. ICC penalizes that systematic bias when the two-way model is used.
Cohen's kappa measures agreement between two raters on a categorical outcome, correcting for the agreement that would arise by chance. Kappa is appropriate for nominal or ordinal categorical ratings. The Cohen's kappa for categorical agreement walkthrough drills into the categorical case. ICC is for continuous outcomes; kappa is for categorical. They are not interchangeable.
Intraclass correlation coefficient measures the proportion of total variance attributable to between-subject variability for continuous outcomes. It can accommodate two raters or many raters, and it can decompose variance to penalize systematic rater bias separately from random error.
The practical rule: continuous outcome with multiple raters means ICC. Categorical outcome with two raters means kappa. The choosing the right statistical test decision guide walks through related selection cases.
Need statistical analysis support?
Our PhD statisticians handle data analysis, produce reproducible R code, and write results sections that satisfy peer reviewers.
Confidence Intervals: Fisher z-Transform and Bootstrap
A point estimate of ICC is almost never sufficient. Reliability research expects a 95% confidence interval that quantifies the precision of the estimate.
The Fisher z-transformation is the classical approach. Apply z = 0.5 * ln((1 + ICC) / (1 - ICC)), construct a confidence interval on the z scale with the appropriate standard error, and back-transform to the ICC scale. The standard error depends on the number of subjects, the number of raters, and the model. R's psych::ICC() and irr::icc() compute Fisher-based confidence intervals by default.
Bootstrap confidence intervals are recommended when sample sizes are small (under 30 subjects) or when the assumptions of the parametric Fisher approach are dubious. Resample subjects with replacement, compute ICC on each bootstrap sample, and use the percentile method on the resulting bootstrap distribution. R's boot package combined with a wrapper function for psych::ICC() produces bootstrap intervals readily.
A common mistake is to report the point estimate without the interval. A point estimate of 0.85 with a 95% confidence interval of 0.40 to 0.95 means very different things than a point estimate of 0.85 with a 95% confidence interval of 0.82 to 0.88. The former says "we cannot rule out poor reliability"; the latter says "reliability is good and the estimate is precise."
Interpretation Thresholds: From Poor to Excellent Reliability
Koo and Li 2016 proposed widely cited thresholds for clinical reliability research:
Below 0.50: poor reliability
0.50 to 0.75: moderate reliability
0.75 to 0.90: good reliability
Above 0.90: excellent reliability
Earlier conventions (Cicchetti 1994; Fleiss 1986) used slightly different thresholds. The thresholds are heuristic, not hard cutoffs: a reliability of 0.78 with a 95% confidence interval extending from 0.65 to 0.88 is meaningfully different from a point estimate of 0.78 with a 95% confidence interval of 0.75 to 0.81. Always report the interval and let readers calibrate the interpretation.
Critically, the appropriate threshold depends on the use case. For research where the measurement is averaged across multiple participants in a comparison, modest reliability (above 0.70) may be acceptable. For individual clinical decision-making, where each patient receives one rating that informs a diagnosis or treatment, higher reliability (0.90 or above) is typically expected.
Sample Size Planning for ICC Studies
The sample size for an intraclass correlation coefficient study depends on the expected ICC, the desired width of the confidence interval, the number of raters per subject, and the number of measurements per subject.
The most widely used framework is Walter, Eliasziw, and Donner 1998, which provides closed-form formulas for the number of subjects needed to estimate an ICC with a specified precision (typically a confidence-interval half-width). The general pattern: higher expected ICC requires fewer subjects (less variance to characterize), more raters per subject allows fewer subjects (more information per subject), and tighter confidence-interval requirement requires more subjects.
As a rough heuristic: a reliability study with two raters wanting to estimate an ICC near 0.80 with a 95% confidence interval half-width of 0.10 needs roughly 30 to 50 subjects. For three raters, 20 to 30 subjects often suffice. For higher expected ICC (above 0.90), the precision-driven sample size can drop to under 20 subjects. The exact number depends on the assumed ICC and the precision target.
For research with a pre-specified reliability threshold (for example, demonstrating that ICC exceeds 0.70), the question becomes a test rather than an estimate, and sample size formulas differ accordingly. For complex designs (more than two raters, repeated measurements within sessions), simulation-based sample size planning via R or SAS is often required. The statistical analysis services team and biostatistics support services typically handle this calculation for clinical reliability studies.
Software: R, SPSS, Stata
Every major statistical package computes the intraclass correlation coefficient.
R: psych package. The psych::ICC() function computes all six Shrout-Fleiss models simultaneously and returns Fisher confidence intervals. Input is a subject-by-rater data frame. Example: psych::ICC(my_data) returns a table with ICC1, ICC2, ICC3, ICC1k, ICC2k, ICC3k each with point estimates and 95% confidence intervals.
R: irr package. The irr::icc() function computes a specific model and is sometimes used when a single model is required. Arguments specify the model ("oneway" or "twoway"), the type ("agreement" or "consistency"), and the unit ("single" or "average").
SPSS Reliability Analysis. Under Analyze → Scale → Reliability Analysis, with the Intraclass Correlation Coefficient option enabled, SPSS computes the Shrout-Fleiss models. The user selects the model and unit; SPSS labels them as "One-way Random", "Two-Way Random", and "Two-Way Mixed", each with single-measure or average-measure variants.
Stata. The icc command computes a specific Shrout-Fleiss model. Syntax: icc rating subject rater, mixed or icc rating subject rater, random. Stata accepts the same selection logic but uses slightly different terminology.
Python: pingouin. The pingouin.intraclass_corr() function computes ICC1, ICC2, ICC3 with their single and average variants, modeled on R's psych package output.
The output is generally a coefficient between 0 and 1 (technically can extend below 0 for very poor reliability but this is rare), a confidence interval, and an F statistic with degrees of freedom and a p-value for the null hypothesis that ICC equals zero.
Worked Example: Two Raters Score Five Patients
Five patients were assessed for shoulder range of motion in degrees by two independent physical therapists. The data:
Output for ICC(2,1): the point estimate is approximately 0.99 with a 95% confidence interval of approximately 0.90 to 1.00. The interpretation: between-subject variability dominates within-subject variability, and the two raters agree closely. Reliability is excellent.
A more interesting example occurs when raters disagree more substantially. Imagine the same patients but Rater 2's scores are systematically 20 degrees higher: (165, 152, 140, 178, 130). Pearson r would still be 1.0 (perfect linear association). ICC(2,1), which penalizes the systematic bias, would drop to roughly 0.50 (moderate reliability). ICC(3,1), which ignores systematic rater bias, would remain near 1.0. The choice of model genuinely matters.
Reporting Reliability in a Manuscript
A reliability paragraph in a manuscript should report the model, the unit (single-measure or average-measure), the point estimate, the 95% confidence interval, the sample size, the number of raters, and the interpretation.
A reproducible reporting template:
"Inter-rater reliability of [outcome] was assessed using the two-way random-effects single-measure intraclass correlation coefficient, ICC(2,1), in [N] subjects scored independently by [K] raters. ICC(2,1) was 0.85, 95% confidence interval 0.78 to 0.91, indicating good reliability per the Koo and Li 2016 thresholds. Analysis was performed in R using psych::ICC()."
For reliability studies that inform a downstream systematic review or measurement instrument validation, the same reporting standards apply. When reliability is being assessed for a screening or extraction process inside a systematic review, the second reviewer reliability workflow integrates the reliability calculation into the broader screening and extraction record.
ICC reporting checklist: seven items to include in every manuscript
Frequently Asked Questions
What does an ICC of 0.7 mean?
An intraclass correlation coefficient of 0.7 indicates that 70 percent of the total variance in the measurement is attributable to differences between subjects, and 30 percent to measurement error or rater disagreement. Per Koo and Li 2016 thresholds, 0.7 sits in the moderate reliability range (0.50 to 0.75) at the upper boundary, just below the threshold for good reliability (0.75 to 0.90). The interpretation should always include the 95% confidence interval: ICC of 0.7 with a tight interval of 0.65 to 0.75 means a different thing than ICC of 0.7 with a wide interval of 0.40 to 0.85.
What is the difference between ICC and Pearson correlation?
Pearson r measures the strength of linear association between two variables and is symmetric in the variables. ICC measures the proportion of total variance attributable to between-subject differences, with options that penalize systematic rater bias. The classical illustration: if Rater A scores everyone exactly 1 point higher than Rater B, Pearson r between A and B is 1.0 (perfect linear association) but ICC(2,1) (two-way random-effects, penalizes bias) is well below 1.0. ICC is the right statistic for reliability research; Pearson r is the right statistic for association studies.
Which ICC model should I report?
Use the Koo and Li 2016 framework: (1) if the same raters score every subject, use a two-way model (model 2 or 3); (2) if raters are a sample of a larger pool you want to generalize to, use model 2; if raters are the only raters of interest, use model 3; (3) report single-measure if clinical decisions use one rating, average-measure if they use the average of multiple ratings. For most published clinical reliability studies, ICC(2,1) (two-way random-effects single-measure) is the most common choice.
Is ICC the same as Cronbach alpha?
Not identical, but related. Cronbach's alpha measures internal consistency reliability for a multi-item scale (the items are the raters, in effect). ICC(3,k) (two-way mixed-effects average-measure) is mathematically equivalent to standardized Cronbach's alpha when items are scored on the same scale. For inter-rater reliability of a single measurement across multiple raters, ICC is the right statistic; for the internal consistency of a multi-item scale, alpha is conventional. The choice depends on the design.
How do you interpret intraclass correlation coefficient?
The point estimate ranges from 0 (no reliability, all variance is within-subject) to 1 (perfect reliability, all variance is between-subject). Always pair it with the 95% confidence interval. Use Koo and Li 2016 thresholds: below 0.50 is poor; 0.50 to 0.75 is moderate; 0.75 to 0.90 is good; above 0.90 is excellent. Calibrate the interpretation to the use case: research averaging across participants tolerates moderate reliability; individual clinical decision-making requires high reliability.
What is a good ICC value?
For most clinical research applications, a point estimate above 0.75 with a tight 95% confidence interval that stays above 0.60 is considered good reliability. Above 0.90 is excellent reliability and is the typical expectation for measurements that inform individual clinical decisions. Below 0.50 is poor and the measurement is not reliable for practical use. As with all reliability thresholds, the appropriate value depends on the use case and should be calibrated to the consequences of measurement error.
<!-- rg-tool-links -->
Related free tools
To compute every pairwise correlation across many variables at once as a colored matrix, use the free correlation matrix generator, which reports Pearson and Spearman coefficients.
Pro Tip
Default to ICC(2,1) for clinical reliability studies unless the rater design clearly fits a different model. Most published reliability papers use two-way random-effects single-measure because raters are the same across subjects and the researcher wants to generalize to a wider rater pool.
Pro Tip
Always pair the point estimate with the 95% confidence interval. A point estimate of 0.85 with a wide CI (0.40 to 0.95) is meaningfully different from 0.85 with a tight CI (0.82 to 0.88). The interval tells the reader how much precision the estimate has.
Pro Tip
Plan sample size before collecting data. For ICC near 0.80 with a 95% CI half-width of 0.10 and two raters, plan for roughly 30 to 50 subjects. For higher expected ICC, fewer subjects suffice. Walter Eliasziw Donner 1998 formulas or simulation-based planning both work.
Pro Tip
Pearson correlation is not interchangeable with ICC. Pearson r ignores systematic rater bias; ICC two-way models penalize it. If Rater A scores everyone exactly 1 point higher than Rater B, Pearson r is 1.0 but ICC(2,1) drops well below 1.0. Use ICC for reliability research.
Pro Tip
Use bootstrap confidence intervals when sample size is small (under 30 subjects) or when the assumptions of the Fisher z-transform are dubious. R's boot package combined with a wrapper around psych::ICC() produces percentile-method intervals readily.
Frequently Asked Questions
6
An intraclass correlation coefficient of 0.7 indicates that 70 percent of the total variance in the measurement is attributable to differences between subjects and 30 percent to measurement error or rater disagreement. Per Koo and Li 2016 thresholds, 0.7 sits in the moderate reliability range (0.50 to 0.75) at the upper boundary, just below the threshold for good reliability (0.75 to 0.90). Always interpret with the 95% confidence interval: 0.7 with a tight interval (0.65 to 0.75) means a different thing than 0.7 with a wide interval (0.40 to 0.85).
Pearson r measures the strength of linear association between two variables and is symmetric in the variables. ICC measures the proportion of total variance attributable to between-subject differences, with options that penalize systematic rater bias. If Rater A scores everyone exactly 1 point higher than Rater B, Pearson r is 1.0 (perfect linear association) but ICC(2,1) drops below 1.0 because it penalizes the systematic bias. ICC is the right statistic for reliability research; Pearson r is for association studies.
Use the Koo and Li 2016 framework. (1) If the same raters score every subject, use a two-way model (2 or 3). (2) If raters are a sample of a larger pool you want to generalize to, use model 2; if raters are the only raters of interest, use model 3. (3) Report single-measure if clinical decisions use one rating, average-measure if they use the average of multiple ratings. For most published clinical reliability studies, ICC(2,1) (two-way random-effects single-measure) is the standard choice.
Not identical, but related. Cronbach's alpha measures internal consistency reliability for a multi-item scale (the items function as raters). ICC(3,k) (two-way mixed-effects average-measure) is mathematically equivalent to standardized Cronbach's alpha when items are scored on the same scale. For inter-rater reliability of a single measurement across multiple raters, ICC is the right statistic; for internal consistency of a multi-item scale, alpha is conventional.
The point estimate ranges from 0 (no reliability) to 1 (perfect reliability). Always pair it with the 95% confidence interval. Use Koo and Li 2016 thresholds: below 0.50 poor; 0.50 to 0.75 moderate; 0.75 to 0.90 good; above 0.90 excellent. Calibrate the interpretation to the use case: research averaging across participants tolerates moderate reliability; individual clinical decision-making requires high reliability.
For most clinical research applications, a point estimate above 0.75 with a tight 95% confidence interval that stays above 0.60 is considered good reliability. Above 0.90 is excellent reliability and is the typical expectation for measurements that inform individual clinical decisions. Below 0.50 is poor and the measurement is not reliable for practical use. The appropriate threshold depends on the consequences of measurement error in the specific use case.
Share
Found this useful? Share it with your colleagues.
Need statistical analysis support?
Our PhD statisticians handle data analysis, produce reproducible R code, and write results sections that satisfy peer reviewers.
Need a Statistician? Our PhD Team Handles the Numbers.
From data cleaning to advanced statistical analysis, reproducible R code, and a results section ready for peer review. We handle the stats so you focus on the science.
Our promise: Free re-run and re-write if reviewers question the analysis or reporting.
4.9 / 5Quote within a few hoursReproducible R or Stata codePhD methodologistConfidential by default
Dr. Sarah Mitchell holds a PhD in Biostatistics from Johns Hopkins Bloomberg School of Public Health and has over 15 years of experience in systematic review methodology and meta-analysis. She has authored or co-authored 40+ peer-reviewed publications in journals including the Journal of Clinical Epidemiology, BMC Medical Research Methodology, and Research Synthesis Methods. A former Cochrane Review Group statistician and current editorial board member of Systematic Reviews, Dr. Mitchell has supervised 200+ evidence synthesis projects across clinical medicine, public health, and social sciences.
Need a Statistician? Our PhD Team Handles the Numbers.
From data cleaning to advanced statistical analysis, reproducible R code, and a results section ready for peer review. We handle the stats so you focus on the science.
Krippendorff's alpha explained: what it measures, how it differs from Cohen's kappa, acceptable thresholds, and which agreement coefficient fits your coding design.
CHEERS 2022 checklist explained: all 28 items, what changed from CHEERS 2013, and how to report a cost-effectiveness analysis so payers and journals can use it.
SPIRIT 2025 checklist explained: all 34 items by section, what changed from SPIRIT 2013, and how the protocol lines up with CONSORT 2025 when you report the trial.