Transcriptomics Analysis: Methods, Workflow, and Applications
Transcriptomics analysis is the study of the complete set of RNA transcripts in a cell or tissue to understand which genes are active and how they are regulated. This guide explains the methods, from microarrays to RNA sequencing, the analysis workflow, and the diseases and questions transcriptomics is used to answer.
Research Gold Team
June 1, 2026
Have transcriptomic data and need it turned into a functional story? Get a free quote and a PhD bioinformatician will reply within a few hours with scope and timeline.
Key Takeaways
Transcriptomics analysis studies the entire transcriptome, the full set of RNA transcripts, to reveal which genes are active and how they are regulated in a given state.
RNA sequencing has largely replaced microarrays as the method of choice because it measures expression without prior probe design and detects novel transcripts.
The analysis does not stop at a differential gene list: the value of transcriptomics comes from functional enrichment, pathway, and network analysis that interpret the changes.
Transcriptomics is widely used across cancer, immunology, neuroscience, and infectious disease to find biomarkers, mechanisms, and drug responses.
A defensible transcriptomic study fixes the experimental design and the statistical model before sequencing, then documents every tool and version for reproducibility.
Over-representation analysis tests a thresholded list and loses direction, while gene set enrichment analysis ranks the whole list and keeps up- and down-regulation; the most damaging error is using all genome genes as the background instead of the genes that could have been detected
Co-expression analysis such as WGCNA groups genes into modules whose eigengenes correlate with traits, moving interpretation from single genes to coordinated programs and candidate hub regulators, with regulator inference suggesting what drives them
For legacy microarray data, RMA preprocessing and the limma moderated t-statistic remain standard, and the moderated t is the conceptual parent of the voom weighting used in RNA-seq
Combine datasets across platforms with explicit batch correction or an effect-size meta-analysis, never by naive merging, and correct batch at the matrix level only for clustering rather than for the differential-expression test itself
Transcriptomics analysis is the study of the transcriptome, the complete set of RNA transcripts in a cell or tissue, to understand which genes are active and how they are regulated. Where a single-gene assay asks about one transcript, transcriptomics takes a genome-wide snapshot of cellular activity in a given state and asks how that whole picture shifts between conditions. This guide covers the methods behind transcriptome analysis, the workflow that turns raw measurements into biology, and the diseases and questions transcriptomics is used to answer.
If you have transcriptomic data and need it turned from a raw expression matrix into a functional story of pathways and mechanisms, or you are deciding which method fits your question, this guide lays out how modern transcriptomic data analysis works and where its value really comes from.
From a Few Genes to the Whole Transcriptome
For decades, molecular biology studied genes one or a handful at a time. Transcriptomics changed the scale: instead of asking whether one gene is on or off, it measures every expressed transcript at once. Because the transcriptome reflects which parts of the genome are active in that moment, a transcriptomic measurement is effectively a genome-wide readout of what a cell is doing, healthy or diseased, treated or untreated, at rest or stimulated.
That breadth is the point. A disease rarely changes a single gene in isolation; it shifts the coordinated activity of whole pathways and networks. Transcriptomics is built to see that coordinated shift, which is why its real value lies less in any single differentially expressed gene and more in the functional patterns that emerge across the data.
Methods: From Microarrays to RNA Sequencing
The methods of transcriptomics have evolved, and the choice among them follows the biological question.
Method
What it measures
Best for
Microarray
Expression of known, probed genes
Legacy datasets, targeted panels
Bulk RNA sequencing
All transcripts, tissue-level average
Standard expression studies
Single-cell RNA sequencing
Expression per individual cell
Cell-type composition and states
Spatial transcriptomics
Expression with physical location
Tissue architecture
Microarrays measure only the sequences their probes were designed for and are now largely superseded. RNA sequencing is the dominant modern method because it measures the transcriptome without predesigned probes, detects novel transcripts, isoforms, and non-coding RNA, and has a wider dynamic range. The mechanics of that workflow, from FASTQ to a count matrix, are covered in depth in our guide to RNA sequencing analysis.
When the tissue-level average is not enough and you need to know which cell types drive a signal, single-cell RNA-seq analysis resolves expression cell by cell. The two approaches are complementary: bulk for depth and simplicity, single-cell for composition.
The Transcriptomics Analysis Workflow
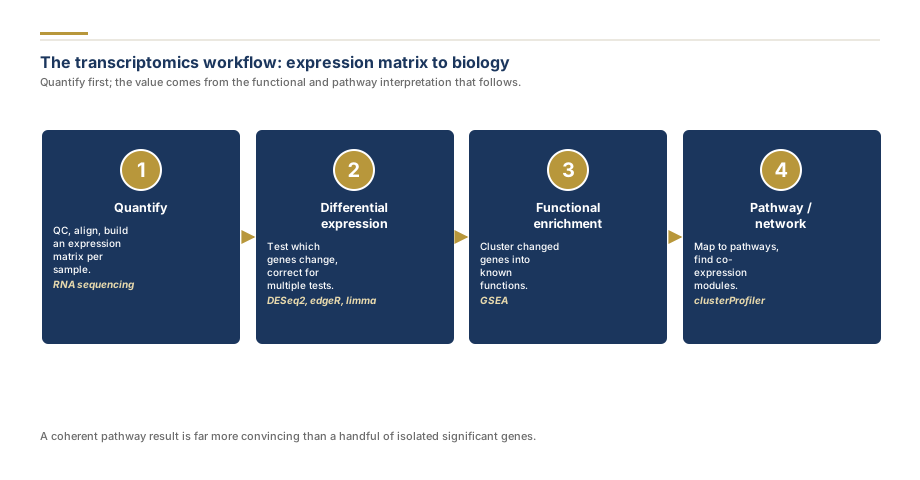
Whatever the platform, a transcriptomic study runs through two halves. The first half quantifies expression; the second, and more important, interprets it.
Quantification. For RNA sequencing this means quality control, alignment or pseudo-alignment, and quantification into an expression matrix of transcripts per sample.
Differential expression. Statistical testing with DESeq2, edgeR, or limma-voom identifies which genes change between conditions, with multiple-testing correction across thousands of genes.
Functional enrichment. Gene set and functional enrichment analysis ask whether the changed genes cluster into known biological functions, rather than reading genes one by one.
Pathway and network analysis. Pathway analysis maps changes onto curated pathways, and co-expression or network analysis finds modules of genes that move together, often pointing to upstream regulators.
The second half is what separates a transcriptomics result from a raw gene list. A coherent enrichment across a known pathway is far more convincing, and far more publishable, than a scattering of isolated significant genes. For the statistical design and modeling underneath this workflow, our our data analysis team handles complex designs, covariates, and batch correction.
Need your own sequencing data analysed?
We run the full pipeline from raw reads to differential expression, enrichment analysis, and publication-ready figures.
Transcriptomics is applied across nearly every disease area. In cancer it defines molecular subtypes, biomarkers, and drug-response signatures that pure histology cannot. In immunology and infectious disease it reveals how a host responds to a pathogen or a therapy. In neuroscience it maps the expression changes behind neurodegenerative and psychiatric conditions, and in metabolic and cardiovascular disease it exposes dysregulated pathways. Across all of these the aim is identical: to connect a change in gene expression to a mechanism, a diagnosis, or a treatment.
The same approach extends beyond expression. When the question is about DNA rather than RNA, variants, mutations, and genome structure, genome sequencing analysis is the corresponding workflow, and all of these analyses run under the reproducible approach described on our computational biology service page.
Functional Interpretation: Over-representation, GSEA, and the Background Problem
The step that turns a gene list into biology is enrichment, and the two dominant approaches answer different questions. Over-representation analysis takes a thresholded list of differentially expressed genes and asks, with a hypergeometric or Fisher exact test, whether any annotated category appears more often than chance. Gene set enrichment analysis keeps the whole ranked list and asks, with a Kolmogorov-Smirnov-style running enrichment score, whether the members of a gene set sit systematically near the top or bottom, so it needs no arbitrary cutoff and preserves the direction of change that over-representation analysis throws away. Annotation comes from Gene Ontology, KEGG, Reactome, or the MSigDB hallmark collection, and significance must be corrected for testing many sets at once.
The single most common and most damaging mistake here is the background, or universe. Enrichment is a comparison against a reference set, and the correct reference is the genes that could have been detected and tested in your experiment, not every gene in the genome. Use the whole genome as the background and ubiquitous pathways will look enriched in almost any list, because the comparison is rigged. A second routine problem is redundancy: Gene Ontology terms overlap heavily, so a raw result lists the same signal twenty times. Collapse it with tools such as clusterProfiler simplify or an enrichment-map visualization so that reviewers see distinct programs rather than restatements of one.
Network and Systems Views: Modules and Regulators
Single-gene testing misses the point that disease shifts coordinated programs, and network methods recover that structure. Weighted gene co-expression network analysis (WGCNA) raises the correlation matrix to a soft-thresholding power chosen to approximate scale-free topology, summarises pairwise similarity into a topological overlap matrix, detects modules of co-expressed genes, and condenses each module to a module eigengene that can be correlated directly with a clinical trait. Genes with the highest connectivity within a trait-linked module are candidate hub regulators. Regulator-level inference goes further: gene regulatory network methods such as GENIE3 or ARACNe, and transcription-factor activity estimators such as DoRothEA with decoupleR, propose which upstream factors drive the observed changes, which is what a mechanistic story actually needs. Note the distinction in how batch is handled: removing it at the matrix level with ComBat or limma removeBatchEffect is appropriate for clustering and visualization, but for differential expression you keep batch as a term in the model rather than testing on batch-corrected values.
Legacy and meta-analytic work still depends on microarray methods, which are mature rather than obsolete. RMA preprocessing (background correction, quantile normalization, and median-polish summarization) produces the log2 intensities, and limma's empirical Bayes moderated t-statistic, which borrows variance information across genes, remains the standard test and is the conceptual parent of the voom weighting used in RNA-seq. Combining datasets across platforms is not a matter of pasting matrices together: differences between studies are large batch effects, so you either correct them explicitly or, more defensibly, run a proper meta-analysis that combines effect sizes or p-values across studies. Naive merging manufactures signal that is really just platform difference.
A complete transcriptomics analysis ships as a package: a quality-control report, the reproducible pipeline with every tool version pinned, the expression matrix, differential expression tables, functional enrichment and pathway results, and methods text ready for your manuscript. When those results need to become journal figures, enrichment dot plots, pathway diagrams, and heatmaps, our scientific figure design produces final, publication-compliant graphics.
When you are ready, get a free quote with a short description of your platform and design, or explore the full list of research services to combine transcriptomics with statistics, visualization, or manuscript support.
Pro Tip
Decide your biological question before choosing a method: bulk RNA-seq for tissue-level expression, single-cell for composition, and targeted panels when only specific genes matter.
Pro Tip
Interpret pathways, not just genes; a coherent enrichment result across a known pathway is far more convincing to reviewers than a handful of isolated significant genes.
Pro Tip
Watch for batch effects in any multi-sample transcriptomic study, and model them explicitly rather than hoping they average out.
Pro Tip
Get the enrichment background right
Enrichment significance depends entirely on the universe you test against. Use the set of genes actually expressed and testable in your experiment as the background, not every gene in the genome, or ubiquitous pathways look enriched in any list. Prefer gene set enrichment analysis when you want to keep the direction of change.
Pro Tip
Move from gene lists to modules and regulators
A scatter of significant genes is weaker evidence than a coherent program. Use co-expression analysis such as WGCNA to find modules tied to your phenotype, and transcription-factor activity or regulator inference to suggest what drives them, which is what turns a list into a mechanism a reviewer will believe.
Frequently Asked Questions
5
Transcriptomics analysis is the study of the transcriptome, the complete set of RNA transcripts present in a cell, tissue, or organism under a particular condition. By measuring which genes are transcribed and at what level, it reveals which genes are active, how expression changes between states such as healthy and diseased, and how genes are co-regulated into pathways and networks. Modern transcriptomics is performed mainly with RNA sequencing and combines differential expression testing with functional enrichment and pathway analysis to interpret the biology.
Transcriptome analysis means examining the full collection of RNA molecules produced by the genome at a given moment, rather than studying a few genes in isolation. Because the transcriptome reflects which parts of the genome are active, analyzing it gives a genome-wide snapshot of cellular activity. The term covers both the laboratory measurement of transcripts (usually by RNA sequencing) and the computational analysis that turns those measurements into biological conclusions about gene expression and regulation.
You analyse transcriptomic data by first turning the raw measurements into a quantified expression matrix, then testing for differences and interpreting them functionally. For RNA sequencing this means quality control, alignment or pseudo-alignment, and quantification to build a count matrix, followed by differential expression testing with DESeq2, edgeR, or limma-voom. The crucial second half is functional interpretation: gene set enrichment, pathway analysis, and network or co-expression analysis that explain what the changed genes are doing together. Every step is documented for reproducibility.
The dominant modern method is RNA sequencing, which measures the transcriptome without needing predesigned probes and detects novel transcripts, isoforms, and non-coding RNA. Single-cell RNA sequencing extends this to individual cells, resolving the cell types within a tissue, and spatial transcriptomics adds the physical location of expression within a sample. Older microarray platforms are still used but are limited to known sequences. The choice of method follows the biological question, with bulk RNA-seq remaining the workhorse for tissue-level expression studies.
Transcriptomics is applied across almost every disease area. In cancer it identifies molecular subtypes, biomarkers, and drug-response signatures. In immunology and infectious disease it reveals how the host responds to pathogens and therapies. In neuroscience it maps the gene expression changes behind neurodegenerative and psychiatric conditions, and in metabolic and cardiovascular disease it uncovers dysregulated pathways. Across all of these the goal is the same: to connect changes in gene expression to mechanism, diagnosis, or treatment.
Share
Found this useful? Share it with your colleagues.
Need your own sequencing data analysed?
We run the full pipeline from raw reads to differential expression, enrichment analysis, and publication-ready figures.
Sequencing Data Waiting? Our Bioinformaticians Run the Pipeline.
Quality control, alignment, normalization, differential expression, and pathway analysis, with reproducible code and figures ready for your manuscript.
Our promise: Free pipeline re-run and figure revisions if reviewers push back.
4.9 / 5Quote within a few hoursReproducible Bioconda or Nextflow pipelinesPhD methodologistConfidential by default
Research Gold Team is our group of PhD methodologists and statisticians who deliver our systematic review, meta-analysis and statistical analysis work. The same team writes and checks the guides and tools on this site.
From expression matrix to an annotated pathway figure, we run the whole transcriptomics workflow with full methods and code. Get a free quote or browse the full list of research services.
Sequencing Data Waiting? Our Bioinformaticians Run the Pipeline.
Quality control, alignment, normalization, differential expression, and pathway analysis, with reproducible code and figures ready for your manuscript.
RNA sequencing analysis turns raw RNA-seq reads into a list of genes that change between conditions, with the statistics to back it up. This guide walks through the full pipeline, from quality control and alignment to differential expression and pathway analysis, and explains how to interpret and report the results.
The Walker and Avant eight-step concept analysis method explained, why nursing relies on it, and the structural mistakes that cost marks, including attributes that are really consequences.
How to detect and adjust for publication bias in meta-analysis using funnel plots, Egger's test, Begg's rank correlation, Peter's test, and trim-and-fill, with guidance on interpretation, small-study effects, and GRADE Domain 5 assessment.