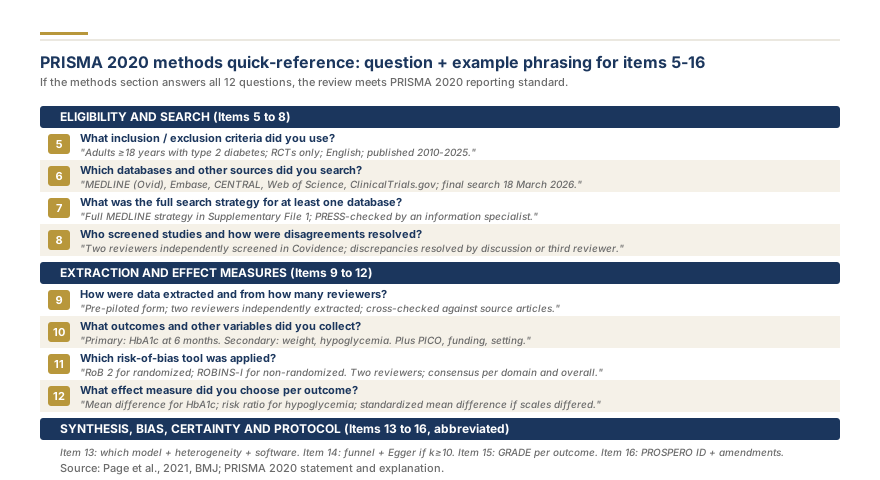
The methods section of a systematic review describes exactly how you identified, selected, appraised, and synthesized the evidence. Under PRISMA 2020 (Page et al., 2021), the methods section spans Items 5 through 16, covering everything from eligibility criteria to certainty assessment. A well-written methods section allows any reader to replicate your review, and it is the section that peer reviewers scrutinize most closely. If a reviewer cannot follow your methods, they will reject the manuscript regardless of your findings. This guide covers each PRISMA 2020 methods sub-item in order, provides example sentences you can adapt, flags the most common reviewer criticisms for each section, and explains how to report protocol deviations and cite the tools you used.
Before writing your methods section, you should have a registered protocol, a completed search, and finalized data extraction. If you have not yet reached that stage, start with our step-by-step guide to writing a systematic review for the full workflow from question formulation to manuscript submission.
Track every reporting item against the PRISMA 2020 checklist template.
Eligibility Criteria: PRISMA 2020 Item 5
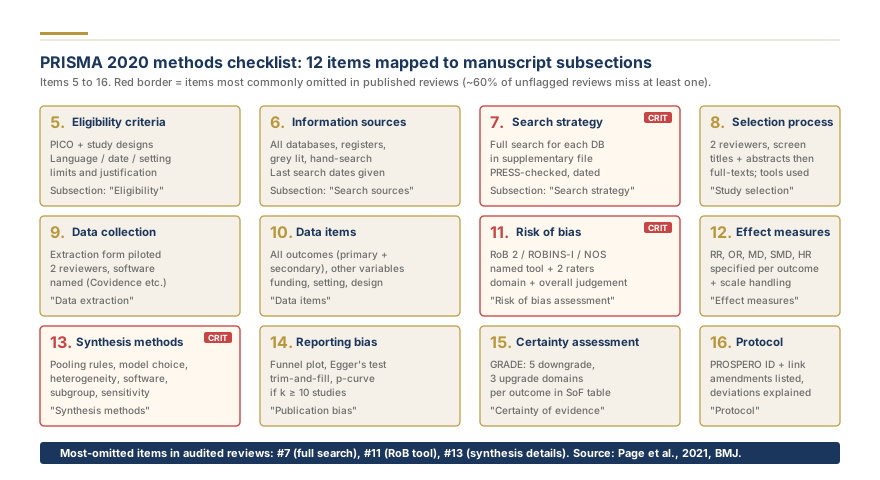
PRISMA 2020 Item 5 requires you to specify the inclusion and exclusion criteria for your review, including the study characteristics (population, intervention, comparator, outcome, and study design) and the report characteristics (language, publication status, and date range). The Cochrane Handbook (Higgins et al., 2023) recommends structuring eligibility criteria around the PICO framework (or PECO for observational reviews), which ensures every element of your research question maps directly to a criterion.
What this subsection must contain:
- The population, intervention or exposure, comparator, and outcome definitions, stated with enough specificity that a second reviewer could independently apply them
- The study designs eligible for inclusion (randomized controlled trials only, or observational studies as well)
- Any restrictions on language, publication date, or publication status (conference abstracts, preprints, grey literature)
- Justification for each restriction, because reviewers will question any limitation that could introduce selection bias
Example paragraph:
We included randomized controlled trials and quasi-experimental studies that enrolled adults aged 18 years or older diagnosed with type 2 diabetes mellitus (Population), compared a structured exercise intervention of at least 12 weeks (Intervention) with usual care or no intervention (Comparator), and reported glycated hemoglobin as a primary outcome (Outcome). We excluded case reports, case series, narrative reviews, and conference abstracts without full-text availability. No language or date restrictions were applied.
Common reviewer criticisms:
- "The eligibility criteria are vague. How do you define 'structured exercise'?" Reviewers want operational definitions, not general terms.
- "Why did you exclude non-English studies? This could bias your results." Always justify language restrictions with a citation or practical rationale.
- "You did not specify the minimum follow-up period." If your outcome requires a time horizon, state it explicitly.
Use our free inclusion and exclusion criteria builder to structure your PICO or PECO elements into a formatted criteria table before drafting this section.
Information Sources: PRISMA 2020 Item 6
PRISMA 2020 Item 6 requires you to list all databases, registers, websites, organizations, reference lists, and other sources you searched or consulted to identify studies. You must also report the date of the most recent search for each source. The Cochrane Handbook recommends searching at least MEDLINE, Embase, and the Cochrane Central Register of Controlled Trials (CENTRAL) for intervention reviews, plus discipline-specific databases relevant to your topic.
What this subsection must contain:
- The full name of every database searched (not just abbreviations)
- The platform or interface used for each database (for example, "MEDLINE via PubMed" or "MEDLINE via Ovid")
- The date of the last search for each database
- Any additional sources: trial registries (ClinicalTrials.gov, WHO ICTRP), grey literature databases (OpenGrey, ProQuest Dissertations), reference lists of included studies, forward citation tracking, and contact with study authors
Example paragraph:
We searched MEDLINE (via PubMed), Embase (via Ovid), the Cochrane Central Register of Controlled Trials (CENTRAL), CINAHL (via EBSCOhost), and PsycINFO (via Ovid) from inception to March 15, 2026. We also searched ClinicalTrials.gov and the WHO International Clinical Trials Registry Platform for ongoing or unpublished studies. Reference lists of all included studies and relevant systematic reviews were screened for additional eligible records. No grey literature databases were searched.
Common reviewer criticisms:
- "You searched only one database. This is insufficient for a systematic review." Two databases is the bare minimum; three or more is standard.
- "You did not report the search dates." Without dates, the review is not reproducible.
- "Why did you not search Embase? You may have missed European and pharmacological literature." Justify any omission of major databases.
Search Strategy: PRISMA 2020 Item 7
PRISMA 2020 Item 7 requires you to present the full search strategy for at least one database, including any filters or limits used. The complete search strategies for all databases should be available in a supplementary file. This is where many methods sections fail, because authors provide only a list of keywords rather than a reproducible search string with Boolean operators, MeSH terms, and field tags.
What this subsection must contain:
- A statement that the full search strategy is available in a supplementary appendix
- The key concepts combined with Boolean operators (AND, OR)
- Whether controlled vocabulary (MeSH, Emtree) was used alongside free-text terms
- Any filters applied (study design filters, date limits, language filters)
- Whether a librarian or information specialist developed or peer-reviewed the search strategy, and if so, using which framework (such as the PRESS checklist)
Example paragraph:
The search strategy was developed in consultation with a health sciences librarian and peer-reviewed using the PRESS (Peer Review of Electronic Search Strategies) checklist. The strategy combined terms for the population (type 2 diabetes mellitus), the intervention (exercise, physical activity, resistance training), and the outcome (glycated hemoglobin, HbA1c) using Boolean operators. Both MeSH terms and free-text synonyms were used. No study design filters were applied. The complete search strategy for all five databases is provided in Supplementary Appendix A.
Common reviewer criticisms:
- "The search strategy is not reproducible. You listed keywords but did not show the actual search string." Always include the full string with Boolean logic and field tags.
- "You did not use controlled vocabulary. Free-text only searches miss indexed records." Combine MeSH/Emtree with free-text for comprehensive retrieval.
- "There is no evidence the search was peer-reviewed." Librarian involvement and PRESS review strengthen credibility.
Build your search strings systematically using the free online search strategy tool, and refer to our search strategy methodology for detailed instructions on combining controlled vocabulary with free-text terms across multiple databases.
Selection Process: PRISMA 2020 Item 8
PRISMA 2020 Item 8 requires you to describe the process used to select studies for inclusion, including the number of reviewers at each stage, how disagreements were resolved, and any automation tools or software used. The Cochrane Handbook mandates independent dual screening at both the title-abstract and full-text stages.
What this subsection must contain:
- How many reviewers independently screened titles and abstracts, and how many screened full texts
- The software or tool used for screening (Covidence, Rayyan, Abstrackr, or manual spreadsheet)
- How disagreements between reviewers were resolved (discussion, third reviewer, consensus)
- Whether a calibration or pilot screening exercise was conducted before formal screening began
- The inter-rater reliability statistic, if calculated (Cohen's kappa or percentage agreement)
Example paragraph:
Two reviewers (S.M. and J.K.) independently screened all titles and abstracts using Covidence systematic review software. Records marked as "include" or "maybe" by either reviewer advanced to full-text screening. Both reviewers then independently assessed full-text articles against the predefined eligibility criteria. Disagreements were resolved through discussion; a third reviewer (A.L.) arbitrated when consensus could not be reached. Before formal screening, both reviewers independently screened a pilot batch of 50 records to calibrate inclusion criteria. Inter-rater agreement at the title-abstract stage was substantial (Cohen's kappa = 0.82).
Common reviewer criticisms:
- "Only one reviewer screened the records. This introduces selection bias." Single-reviewer screening is a critical methodological weakness.
- "You did not describe how disagreements were resolved." Always state the resolution mechanism.
- "What software did you use? This affects reproducibility." Name the tool and version.
Data Collection Process: PRISMA 2020 Item 9
PRISMA 2020 Item 9 covers how data were extracted from included studies, including the number of reviewers who independently extracted data, how disagreements were handled, any automation tools used, and how missing data were obtained from study authors.
What this subsection must contain:
- The number of reviewers who independently extracted data
- Whether a standardized data extraction form was used, and if it was piloted
- The specific data items extracted (see Item 10 for the list)
- How discrepancies between extractors were resolved
- Whether and how study authors were contacted for missing or unclear data
Example paragraph:
Data were extracted independently by two reviewers using a standardized form piloted on three included studies. Extracted items included study characteristics (author, year, country, study design), participant characteristics (sample size, age, sex, baseline glycated hemoglobin), intervention details (type, frequency, duration, supervision), comparator details, and outcome data (mean, standard deviation, and sample size at each time point). Discrepancies between extractors were resolved by discussion, with a third reviewer consulted when agreement could not be reached. Authors of five studies were contacted by email to obtain missing standard deviations; three responded within four weeks.
Common reviewer criticisms:
- "Data were extracted by only one reviewer. This is a significant limitation." Dual extraction is the standard for minimizing transcription errors.
- "You did not describe the data extraction form or pilot it." Piloting catches ambiguities in the form before full extraction begins.
- "How did you handle studies that reported medians and interquartile ranges instead of means and standard deviations?" Describe any conversion methods used (such as Wan et al., 2014 or Luo et al., 2018 estimators).
Study Risk of Bias Assessment: PRISMA 2020 Item 11
PRISMA 2020 Item 11 requires you to describe the methods used to assess the risk of bias in each included study, including the tool used, the domains assessed, and the number of reviewers who independently applied the tool. The Cochrane Handbook (Higgins et al., 2023) recommends RoB 2 for randomized trials and ROBINS-I for non-randomized studies.
What this subsection must contain:
- The specific risk of bias tool used, with a citation
- The domains assessed by that tool (for example, RoB 2 assesses randomization, deviations from intended interventions, missing outcome data, measurement of outcome, and selection of reported result)
- The number of reviewers who independently assessed each study
- How disagreements in risk of bias judgments were resolved
- Whether risk of bias assessments were used in sensitivity analyses or to judge the certainty of evidence
Example paragraph:
Risk of bias in randomized controlled trials was assessed using the Cochrane Risk of Bias 2 (RoB 2) tool (Sterne et al., 2019). Each study was evaluated across five domains: bias arising from the randomization process, bias due to deviations from intended interventions, bias due to missing outcome data, bias in measurement of the outcome, and bias in selection of the reported result. Two reviewers independently assessed each study, and disagreements were resolved by discussion with a third reviewer. Overall risk of bias for each study was classified as low, some concerns, or high. Studies rated as high risk of bias were included in the primary analysis but examined separately in a sensitivity analysis.
Common reviewer criticisms:
- "You used the Newcastle-Ottawa Scale for randomized trials. NOS is designed for observational studies." Match the tool to the study design.
- "Risk of bias was assessed by only one reviewer." Independent dual assessment is required.
- "You did not describe how risk of bias judgments informed your synthesis." Explain whether high-risk studies were excluded from sensitivity analyses or downgraded in certainty assessment.
Effect Measures: PRISMA 2020 Item 12
PRISMA 2020 Item 12 requires you to specify the effect measures used for each outcome (for example, risk ratio, odds ratio, mean difference, standardized mean difference, hazard ratio) and how they were selected.
What this subsection must contain:
- The primary effect measure for each outcome type (dichotomous, continuous, time-to-event)
- The rationale for choosing that measure
- Whether 95 percent confidence intervals were reported
- Any transformations applied (such as converting odds ratios to risk ratios, or using Hedges' g instead of Cohen's d for small samples)
Example paragraph:
For continuous outcomes, we calculated the mean difference when studies used the same measurement scale and the standardized mean difference (Hedges' g) when different scales were used. For dichotomous outcomes, we calculated risk ratios with 95 percent confidence intervals. Risk ratios were preferred over odds ratios because they are more interpretable when event rates are not rare. For time-to-event outcomes, we extracted or calculated hazard ratios with 95 percent confidence intervals.
Common reviewer criticisms:
- "Why did you use odds ratios when event rates exceed 20 percent? Odds ratios overestimate the effect in common outcomes." Justify the choice of effect measure relative to event frequency.
- "You did not specify whether you used Cohen's d or Hedges' g." Small-sample corrections matter; name the exact estimator.
- "Confidence intervals are missing for some outcomes." Always report both point estimates and intervals.
Struggling to draft a methods section that will satisfy peer reviewers? Research Gold's methodologists write and review methods sections for systematic reviews and meta-analyses across all clinical and social science disciplines. If you need expert feedback on your eligibility criteria, search strategy, or synthesis approach, get your project priced and tell us which sections you need help with. We also provide full Research Gold systematic review services from protocol to publication.